KPIs & DASHBOARDS

Real-Time KPI Monitoring and Data Analytics

“To measure is to know” - and that’s undeniably true. 
Many manufacturers implement operator guidance systems not only to prevent errors but also to capture valuable process data that can be analyzed afterward. When questions or disputes arise later in production, this data provides a complete digital record of every build, showing exactly what was done, by whom, and when. 

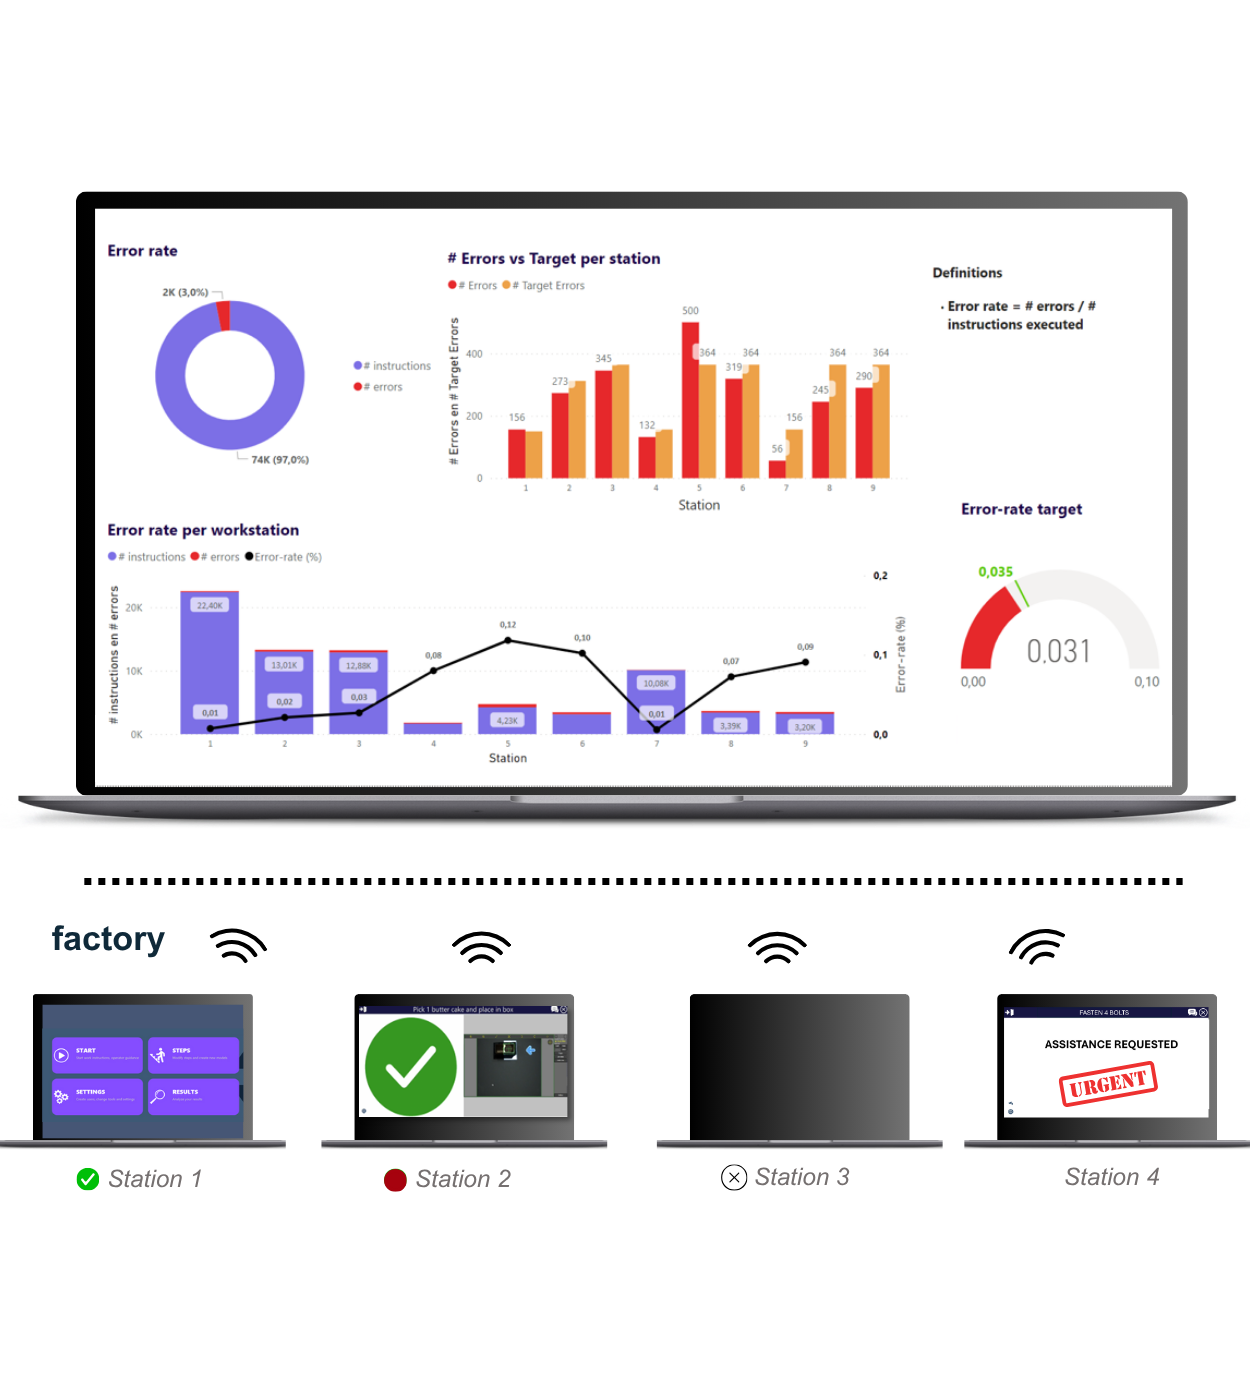
The value multiplies when you begin using this data to uncover bottlenecks, identify patterns, or even predict future issues. With tools like Power BI, you can transform raw data into actionable insights that drive smarter decision-making and continuous improvement. 

Book a demo

Website 16

When to consider?

  • You face costly rework but lack clear visibility into what’s causing it.
  • You don’t have a deep root cause understanding of recurring issues. For example, whether they stem from skill levels, specific teams, shift changes, or missed tightening steps.
  • You want to establish benchmarks and measure performance trends (e.g., number of mistakes per week or per shift).
  • You’re ready to analyze beyond simple product OK/NOK results, and instead measure at a step-by-step level to gain a competitive edge.
  • You want to quantify the cost of errors and the savings achieved through improvement initiatives. 

The value of analysis your data

  • Real-time visibility: Dashboards provide a live overview of shop floor performance, tracking progress, cycle times, and error rates so supervisors can act immediately where support is needed.
  • Bottleneck and trend detection: Visualizing operator guidance data helps identify recurring issues and inefficiencies, improving line balance, workload, and process flow.
  • Workforce insights: Monitor performance, training progress, and workload to identify skill gaps, optimize staffing, and plan targeted upskilling.
  • Continuous improvement: Centralized process data enables evidence-based decisions, impact tracking, and long-term performance measurement.
  • Cost reduction and efficiency gains: Better visibility allows faster issue resolution, less downtime, fewer defects, and optimized resources, driving measurable improvements in productivity and cost savings. 

Feature highlights

Reveal root cause of operator mistake

Data-driven decision making

Operator accountability and performance tracking

What our customers are saying

Ansomat logo

Ansomatic has dramatically reduced the defect rate of our outdoor lightening production. On top, it is so flexible you can tailor it to any process."

Zumtobel Manufacturing Engineer
Previous Previous
Next Next

Ready to start your success journey?

Book your free demo Arrow right
1 / 1